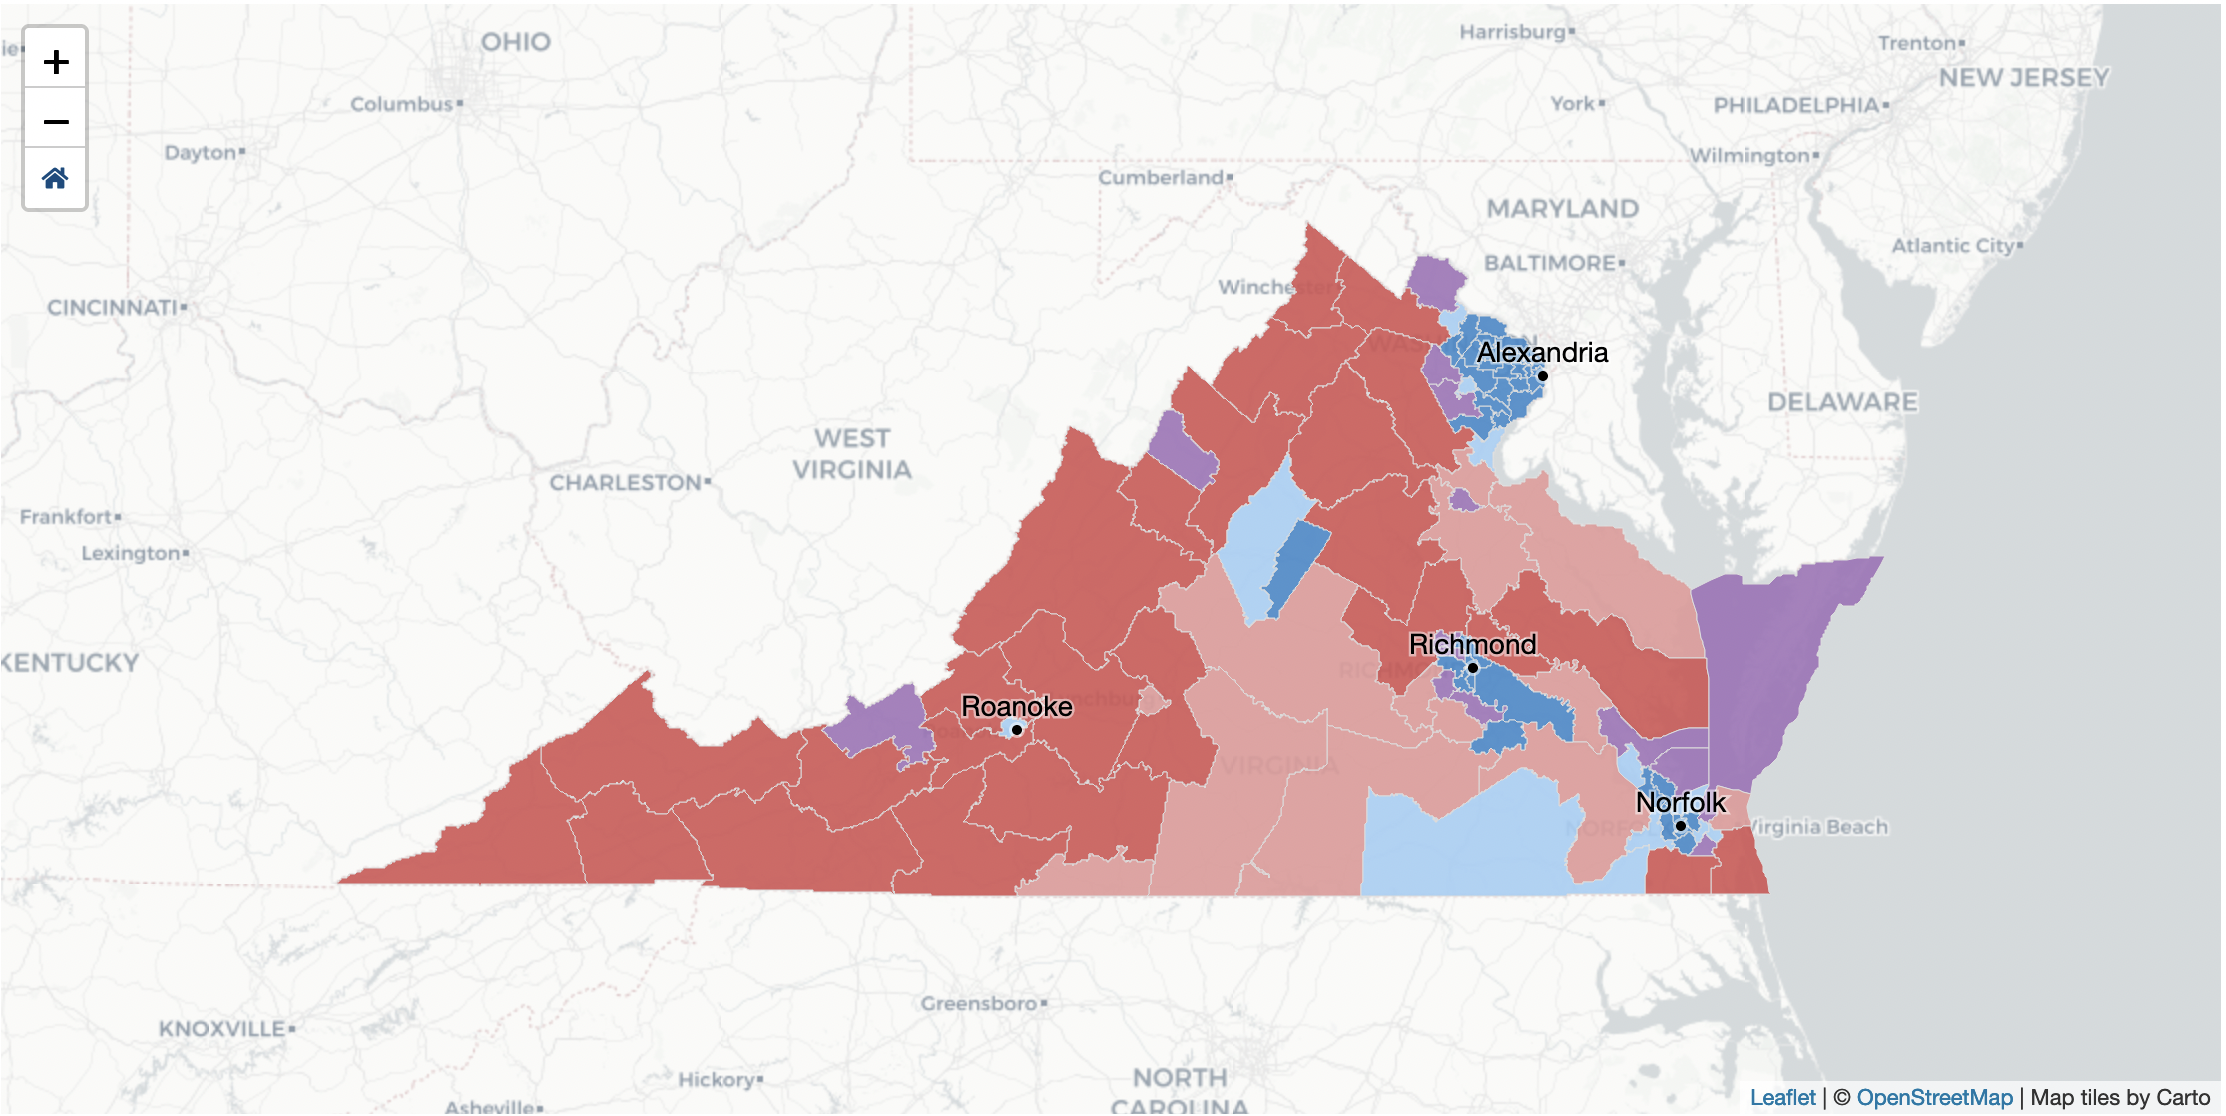
One of the big projects we tackled at VPAP in 2020 is Virginia's redistricting process. With a Redistricting Commission in charge of trying to create new districts, we've been able to visualize and help people make sense of draft plans. I built the front-end code for the maps and charts in this multi-page web application.
Svelte

In 2020, The Virginia GOP decided to run a multi-round, ranked-choice election where delegates' votes were weighted based on where they lived. Despite having only a week to design and build the pages, we created a live election results page. I built the front-end code in d3 and Svelte, as well as much of the server-side code in Django.
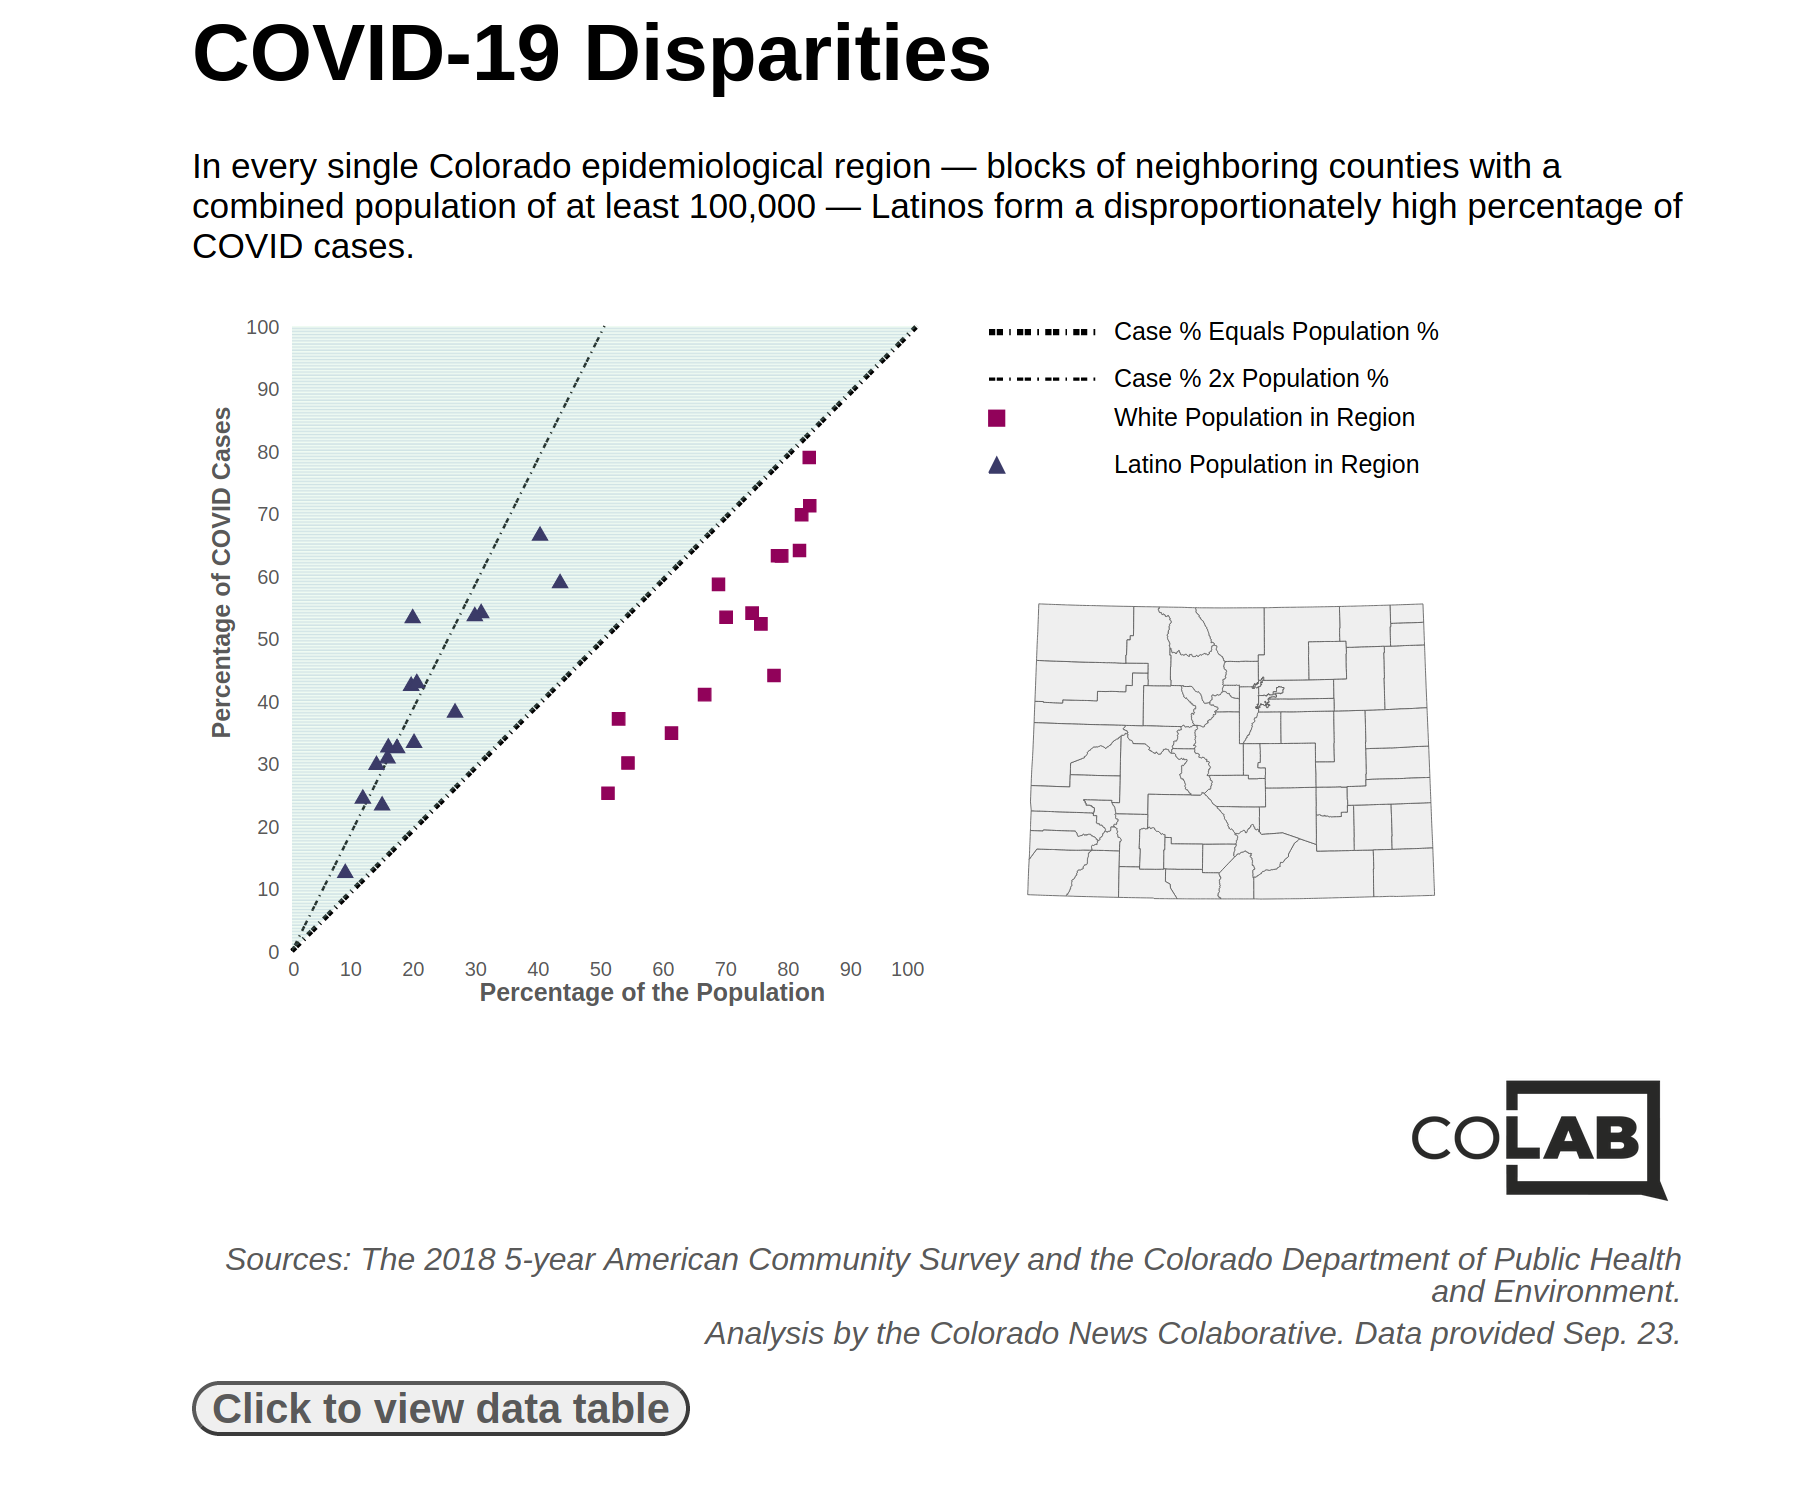
I conducted an analysis and reported most of the interviews for a story showing that Latinos formed a disproportionate rate of COVID-19 cases in every region of Colorado. I also built a graphic displaying the results, using Svelte and a tiny bit of d3.