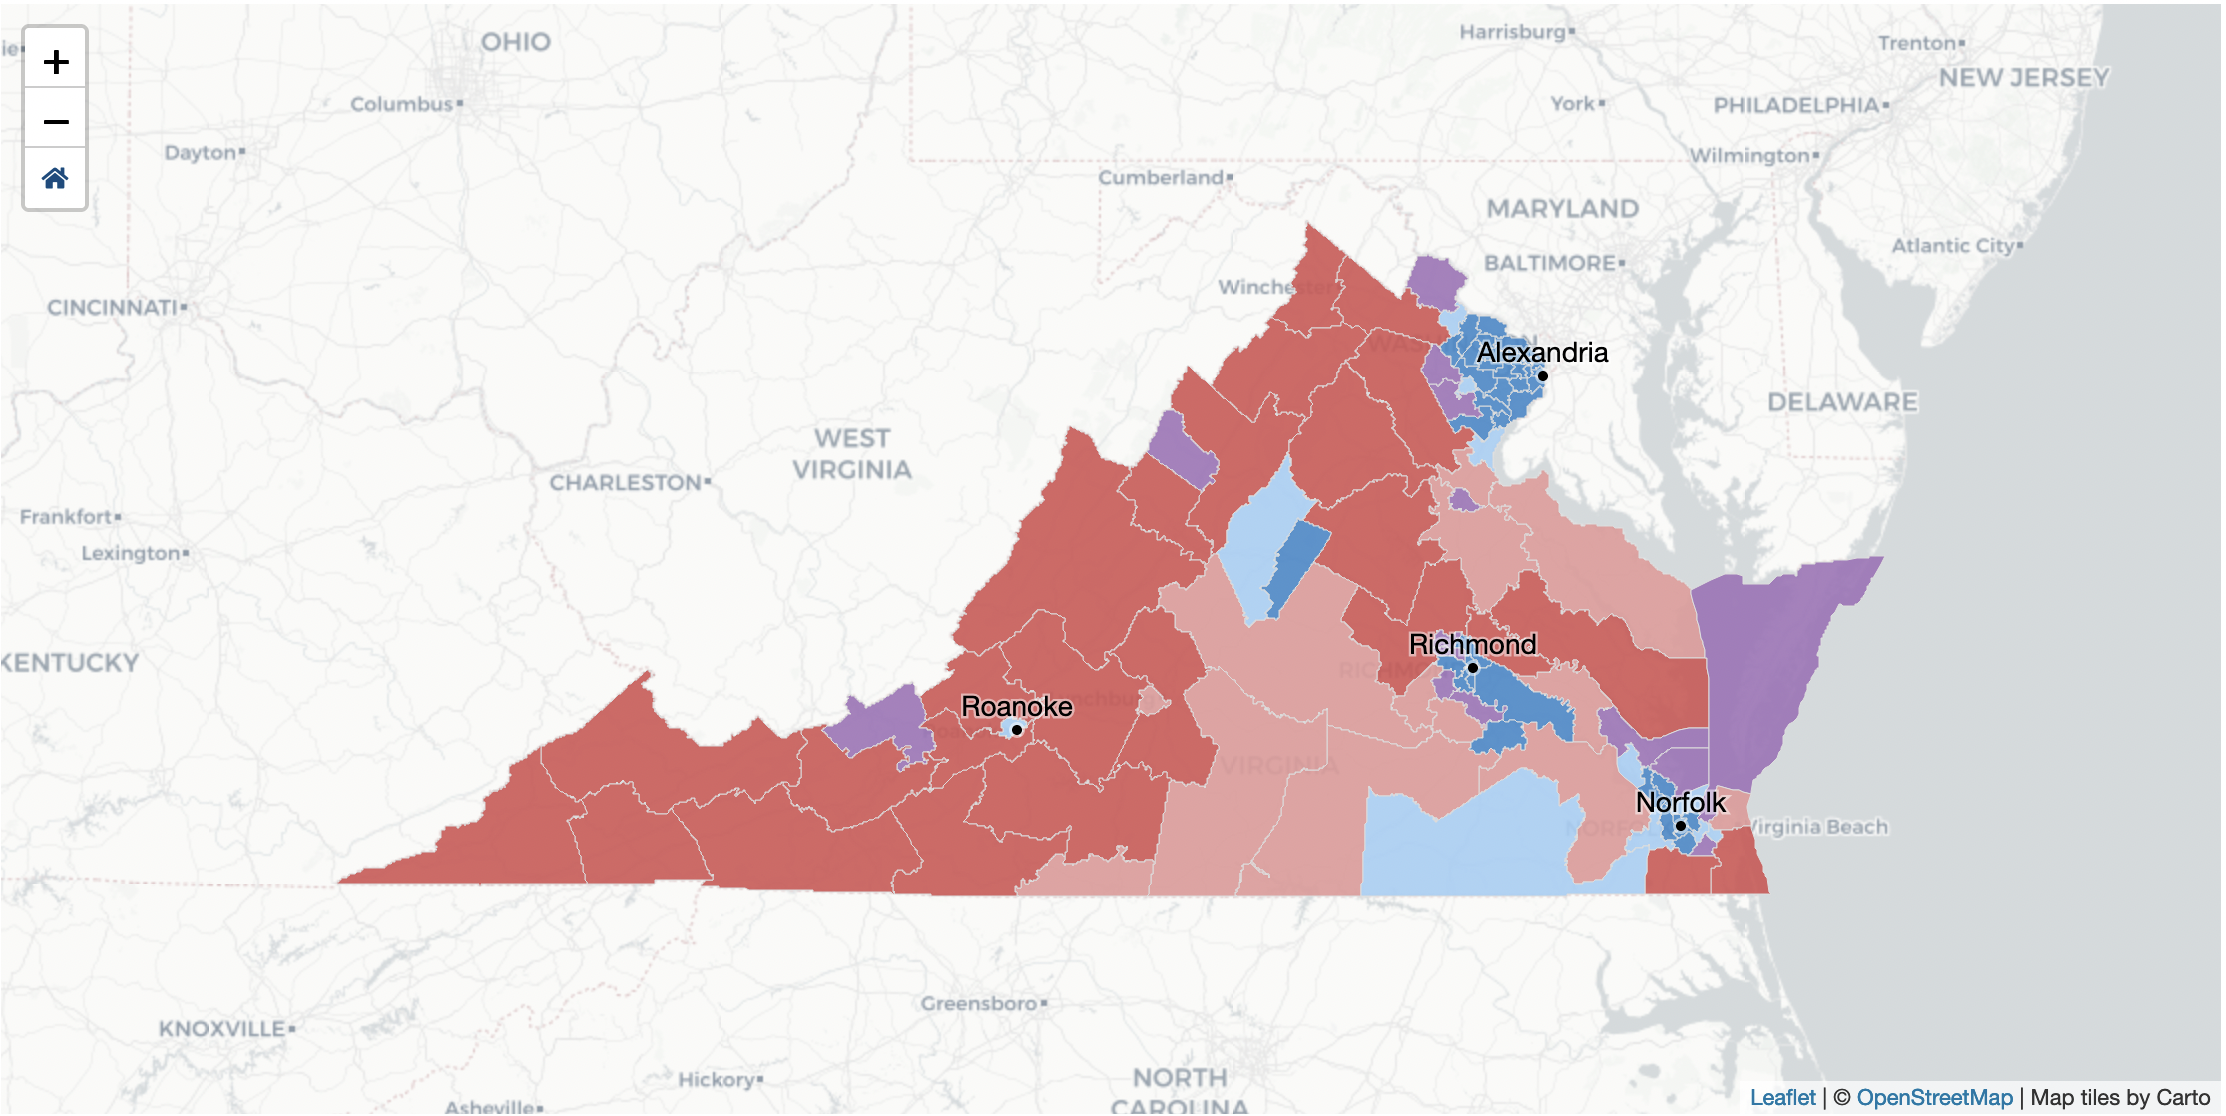
One of the big projects we tackled at VPAP in 2020 is Virginia's redistricting process. With a Redistricting Commission in charge of trying to create new districts, we've been able to visualize and help people make sense of draft plans. I built the front-end code for the maps and charts in this multi-page web application.
Max Lee
I'm a data journalist and developer who has recently graduated from Stanford's MA journalism program. I spent the summer after graduating working as a data reporting intern with the Colorado News Collaborative.
Below, you'll find a list of some of the stories and the work I'm proudest of. You can also see these stories broken down by category or by skills. Or you can view my rèsumè, in HTML or PDF format.
Selected Work

In 2020, The Virginia GOP decided to run a multi-round, ranked-choice election where delegates' votes were weighted based on where they lived. Despite having only a week to design and build the pages, we created a live election results page. I built the front-end code in d3 and Svelte, as well as much of the server-side code in Django.
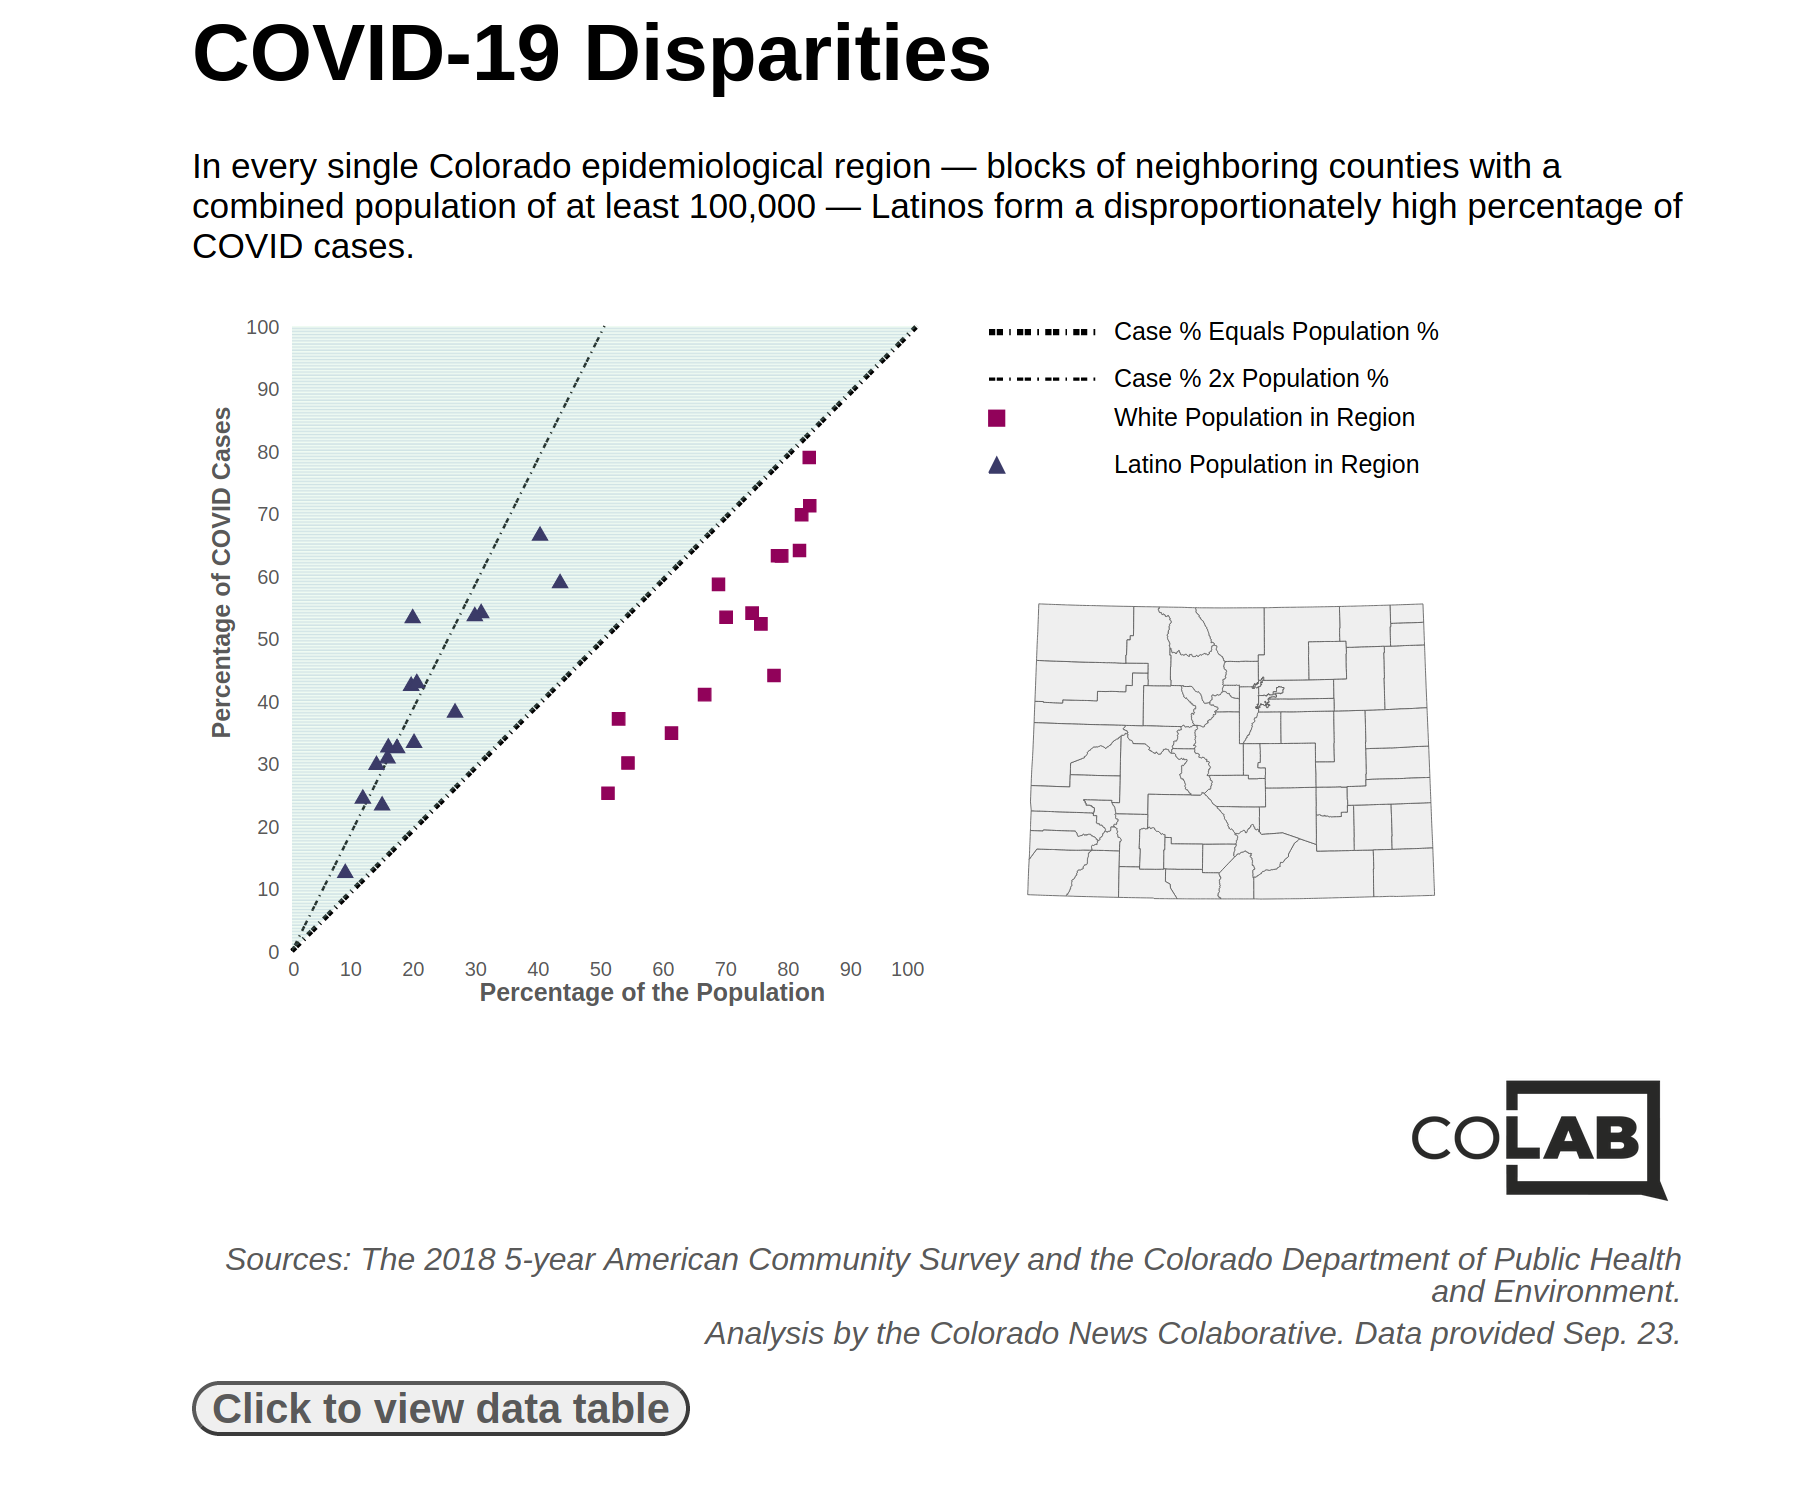
I conducted an analysis and reported most of the interviews for a story showing that Latinos formed a disproportionate rate of COVID-19 cases in every region of Colorado. I also built a graphic displaying the results, using Svelte and a tiny bit of d3.
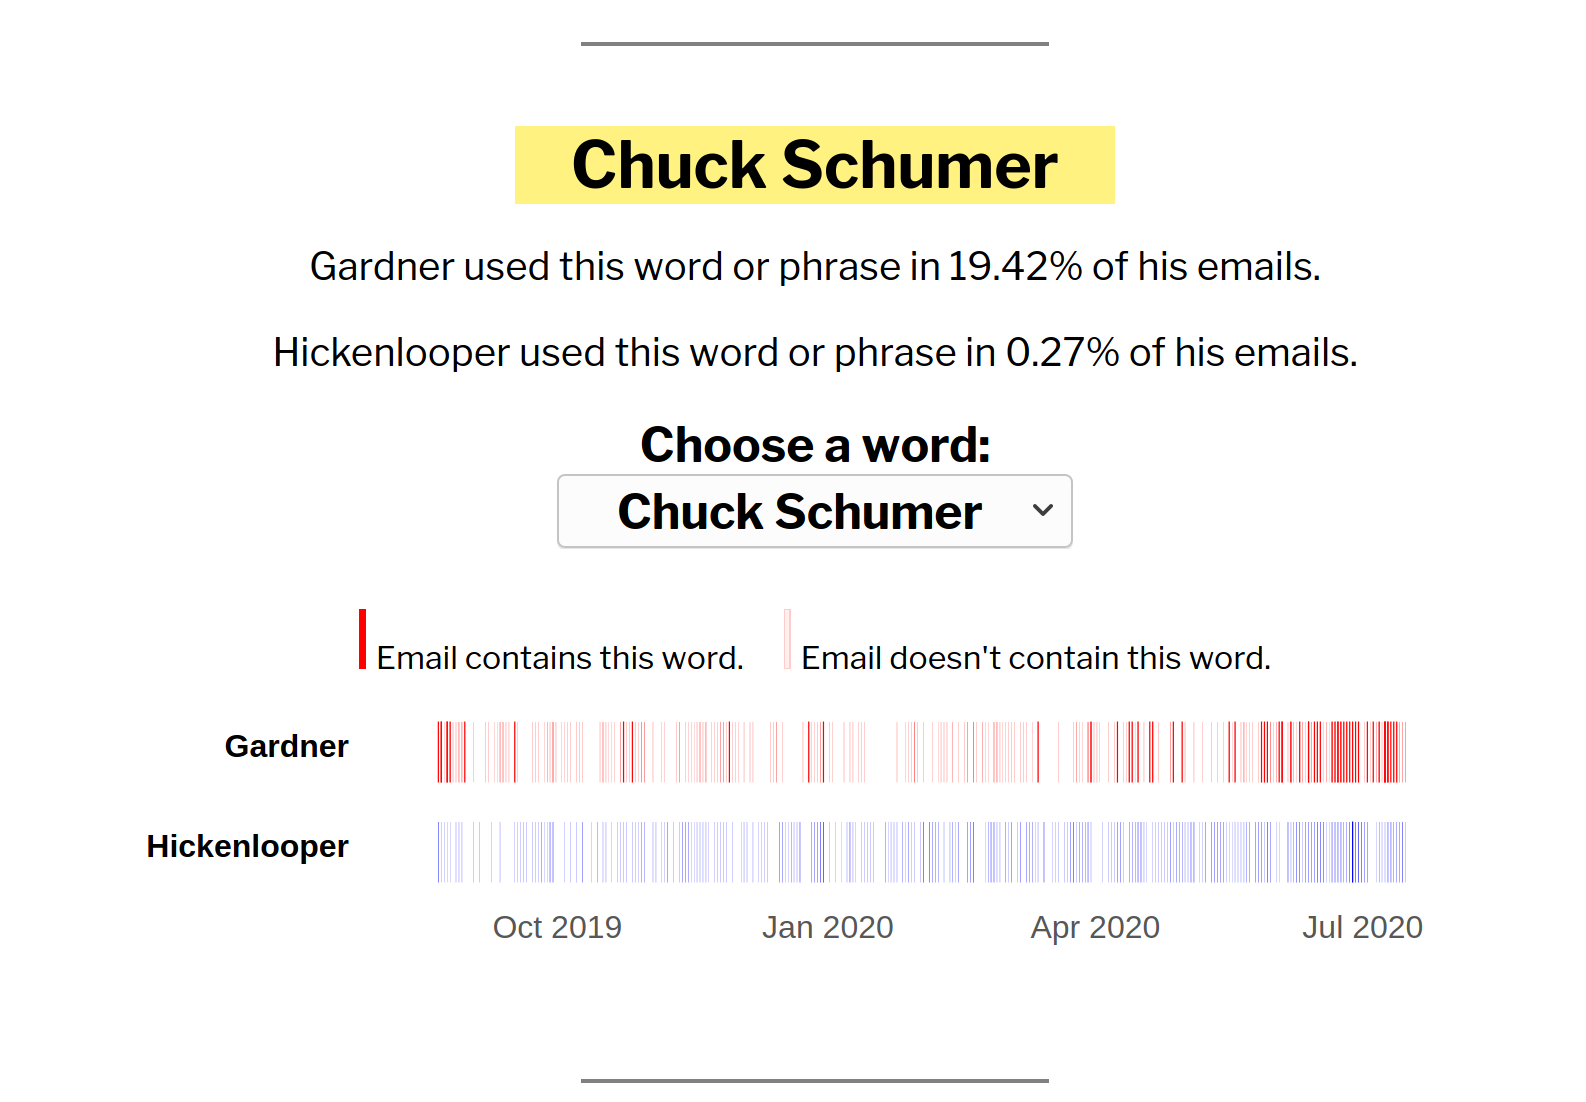
I conducted an analysis and wrote a story about how Senate candidates John Hickenlooper and Cory Gardner used more partisan language in their emails than they did in their campaigns. The pattern is a common feature of campaign emails, which are geared toward a partisan base.
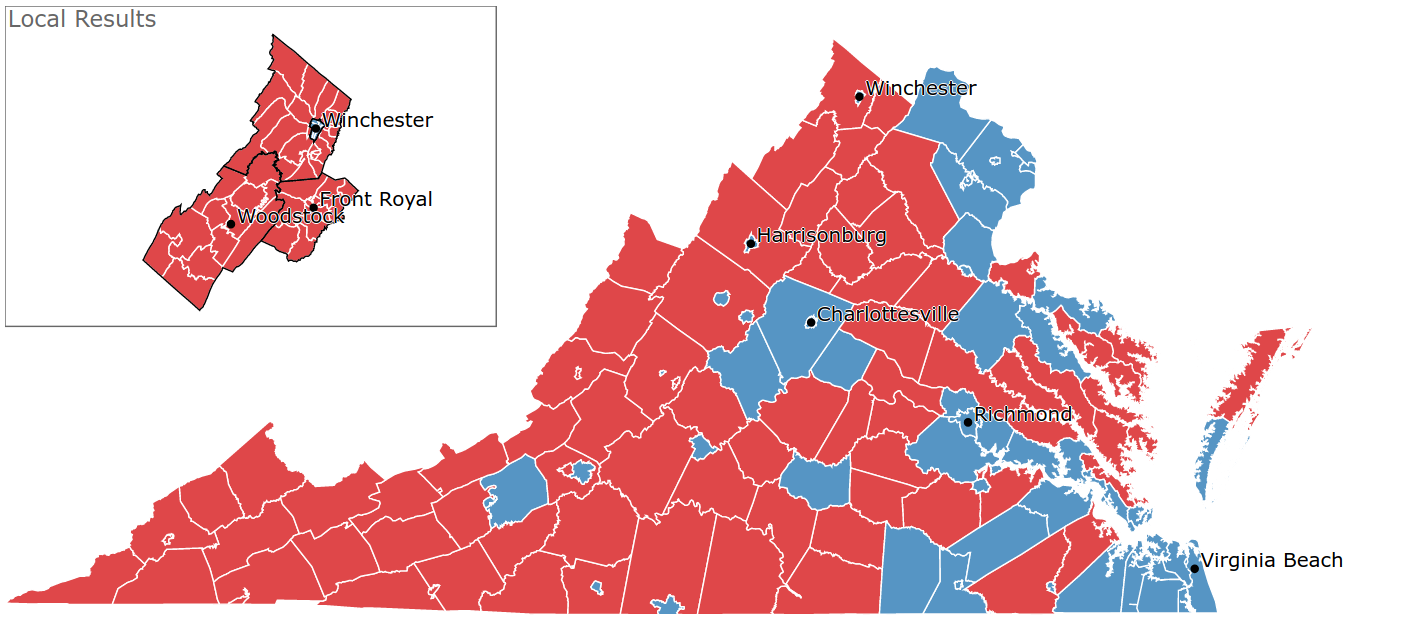
I wrote the front-end and back-end code to display precinct-level election results for northwest Virginia during the 2018 midterms.
As part of this process, I requested precinct shapefiles from 27 localities in Virginia; cleaned and joined the shapefiles using PostgreSQL and PostGIS; wrote code in Python to scrape the results and push them to an AWS S3 bucket; and wrote front-end code in d3 to display the results. I additionally set up an EC2 instance and ran the Python script from there so the script could continue running even if something happened to my computer locally.
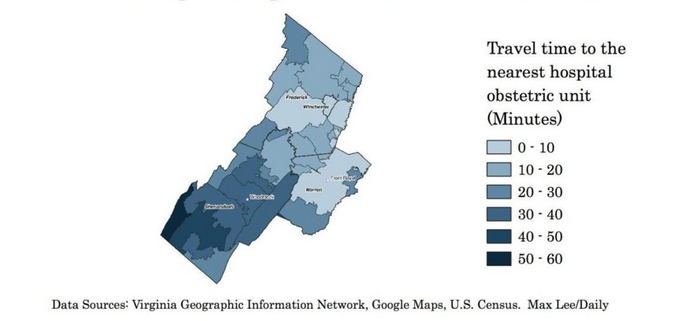
After our local hospital system announced it was cutting obstetric services from one of its hospitals, I wanted to know what impact the decision would have on the amount of time women would have to spend traveling to deliver a baby. I calculated the travel times to the nearest obstetric unit from each ZIP code in our region using Google Maps's API in Python and mapped the results using QGIS.
The change, I found, would mean that more women in our region would have to drive long distances -- with some having to travel close to an hour -- to deliver a baby at a hospital with a devoted obstetric unit.
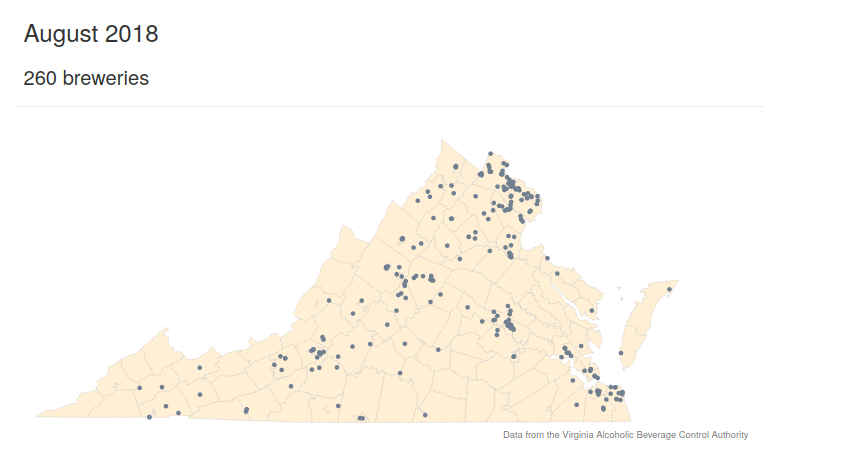
In a one-year period, Strasburg, Virginia — a town of 6,000 people — saw two new breweries come in. A nearby town, Front Royal, also had a new brewery come in that year. I wanted to see what got the owners to start their breweries and why Virginia as a whole had seen such a large spike in the number of new craft breweries.
I interviewed people at two of the three new breweries in our region, helping me identify a new law that helped one of them come into existence. I also conducted some analysis in Python and built a visualization in d3 to demonstrate how fast the growth had been.
A San Josè-based community center for people recovering from mental illnesses, addiction, and homelessness offers culinary and barista training classes for some members. While the program may seem to be focused on getting participants jobs, job training is secondary to helping participants gain confidence and coping mechanisms — skills that many people in recovery struggle to obtain.
I visited the cafè several times and wrote, filmed, and edited a profile about the job training classes. (I used Adobe Premiere Pro for the editing.)
A doctor in Front Royal, Virginia set up a GoFundMe page to help pay for his bone marrow biopses — a sign, I wrote, of how expensive cancer treatment is in the United States.
In November 2017, an affidavit was unsealed in Frederick County, Virginia accusing five members of the Strasburg Fire Department, including the department chief, of having sex with a 17-year-old girl.
But despite the public accusations against him, I found through a public records request, the department's chief responded to five calls after the affidavit was unsealed.
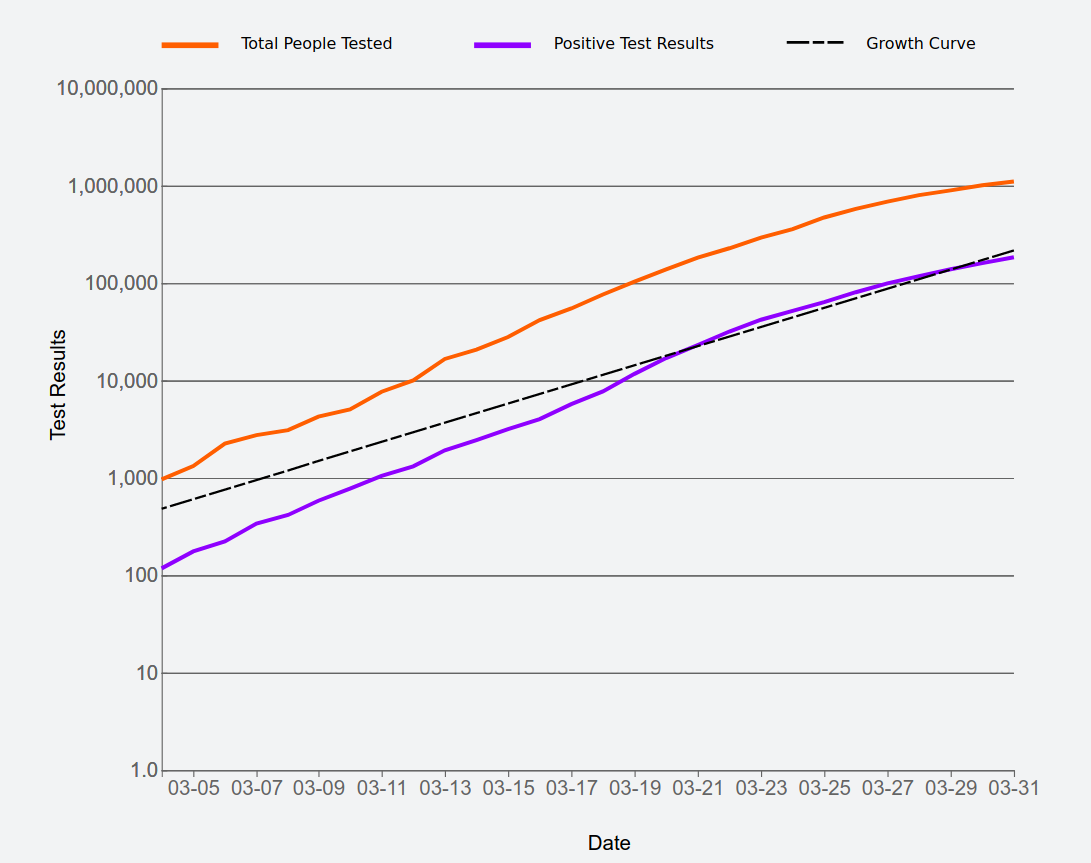
Coronavirus cases have been growing rapidly in the United States, from only around 100 positive tests across the entire country on March 4 to over 5,000 less than two weeks later.
Some of that growth is because testing has become much more available. But the disease itself also poses an enormous threat, holding the potential to overwhelm our health care system.
Using data from the COVID Tracking Project, see how positive and total test results have grown across the country since March 4.
clipivot is a command-line tool I wrote in Rust that generates pivot tables from CSV files or any other delimiter-separated files. It works on arbitrarily large files, including ones that are larger than your RAM.
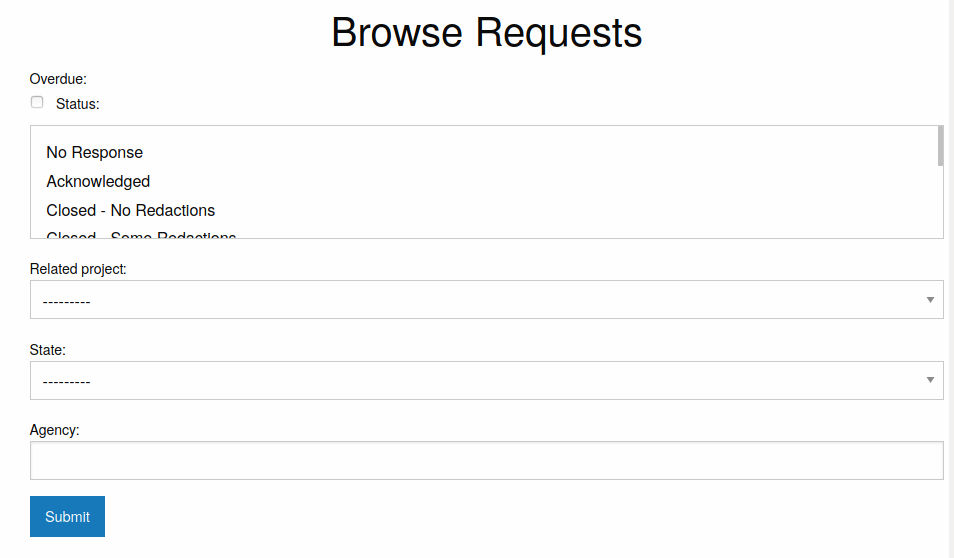
For my master's thesis in Stanford's journalism program, I'm working on a project that involves getting records from a lot of different municipalities.
For data journalists, this is a pretty common problem. A lot of information journalists seek — death records, inspection records, you name it — is collected at the state, county, or municipal level. And data journalists often want to analyze that information across a wide geographic area.
In order to manage this work, I created a Django tool for filing public records requests to multiple agencies at once. I used an early version of this, django_sourcebook, to file requests for a reporting project. Since then, I've worked on building a more interactive version with authentication and tests. That project is foia_integration.