Visualizations

Map showing county-by-county results for Tim Kaine's 2018 Senate win over the Republican challenger, Corey Stewart

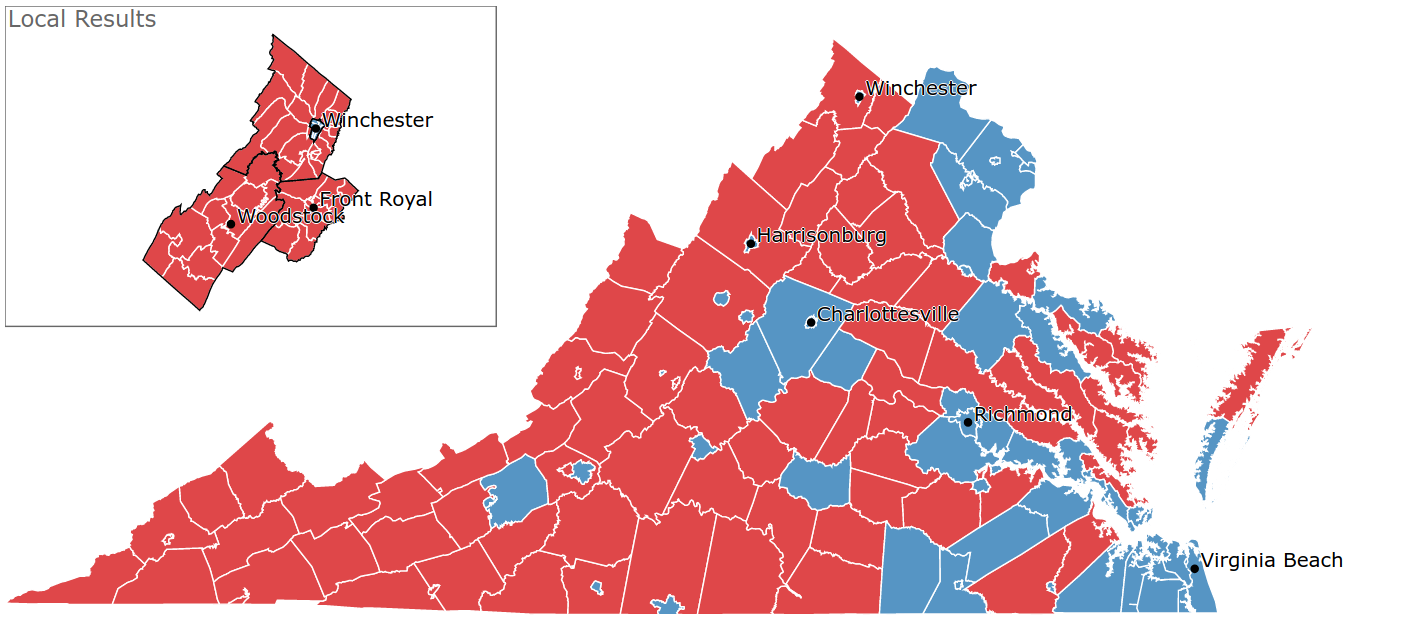
I wrote the front-end and back-end code to display precinct-level election results for northwest Virginia during the 2018 midterms.

As part of this process, I requested precinct shapefiles from 27 localities in Virginia; cleaned and joined the shapefiles using PostgreSQL and PostGIS; wrote code in Python to scrape the results and push them to an AWS S3 bucket; and wrote front-end code in d3 to display the results. I additionally set up an EC2 instance and ran the Python script from there so the script could continue running even if something happened to my computer locally.

Map showing the locations of 260 breweries in Virginia in August 2018

In a one-year period, Strasburg, Virginia — a town of 6,000 people — saw two new breweries come in. A nearby town, Front Royal, also had a new brewery come in that year. I wanted to see what got the owners to start their breweries and why Virginia as a whole had seen such a large spike in the number of new craft breweries.

I interviewed people at two of the three new breweries in our region, helping me identify a new law that helped one of them come into existence. I also conducted some analysis in Python and built a visualization in d3 to demonstrate how fast the growth had been.