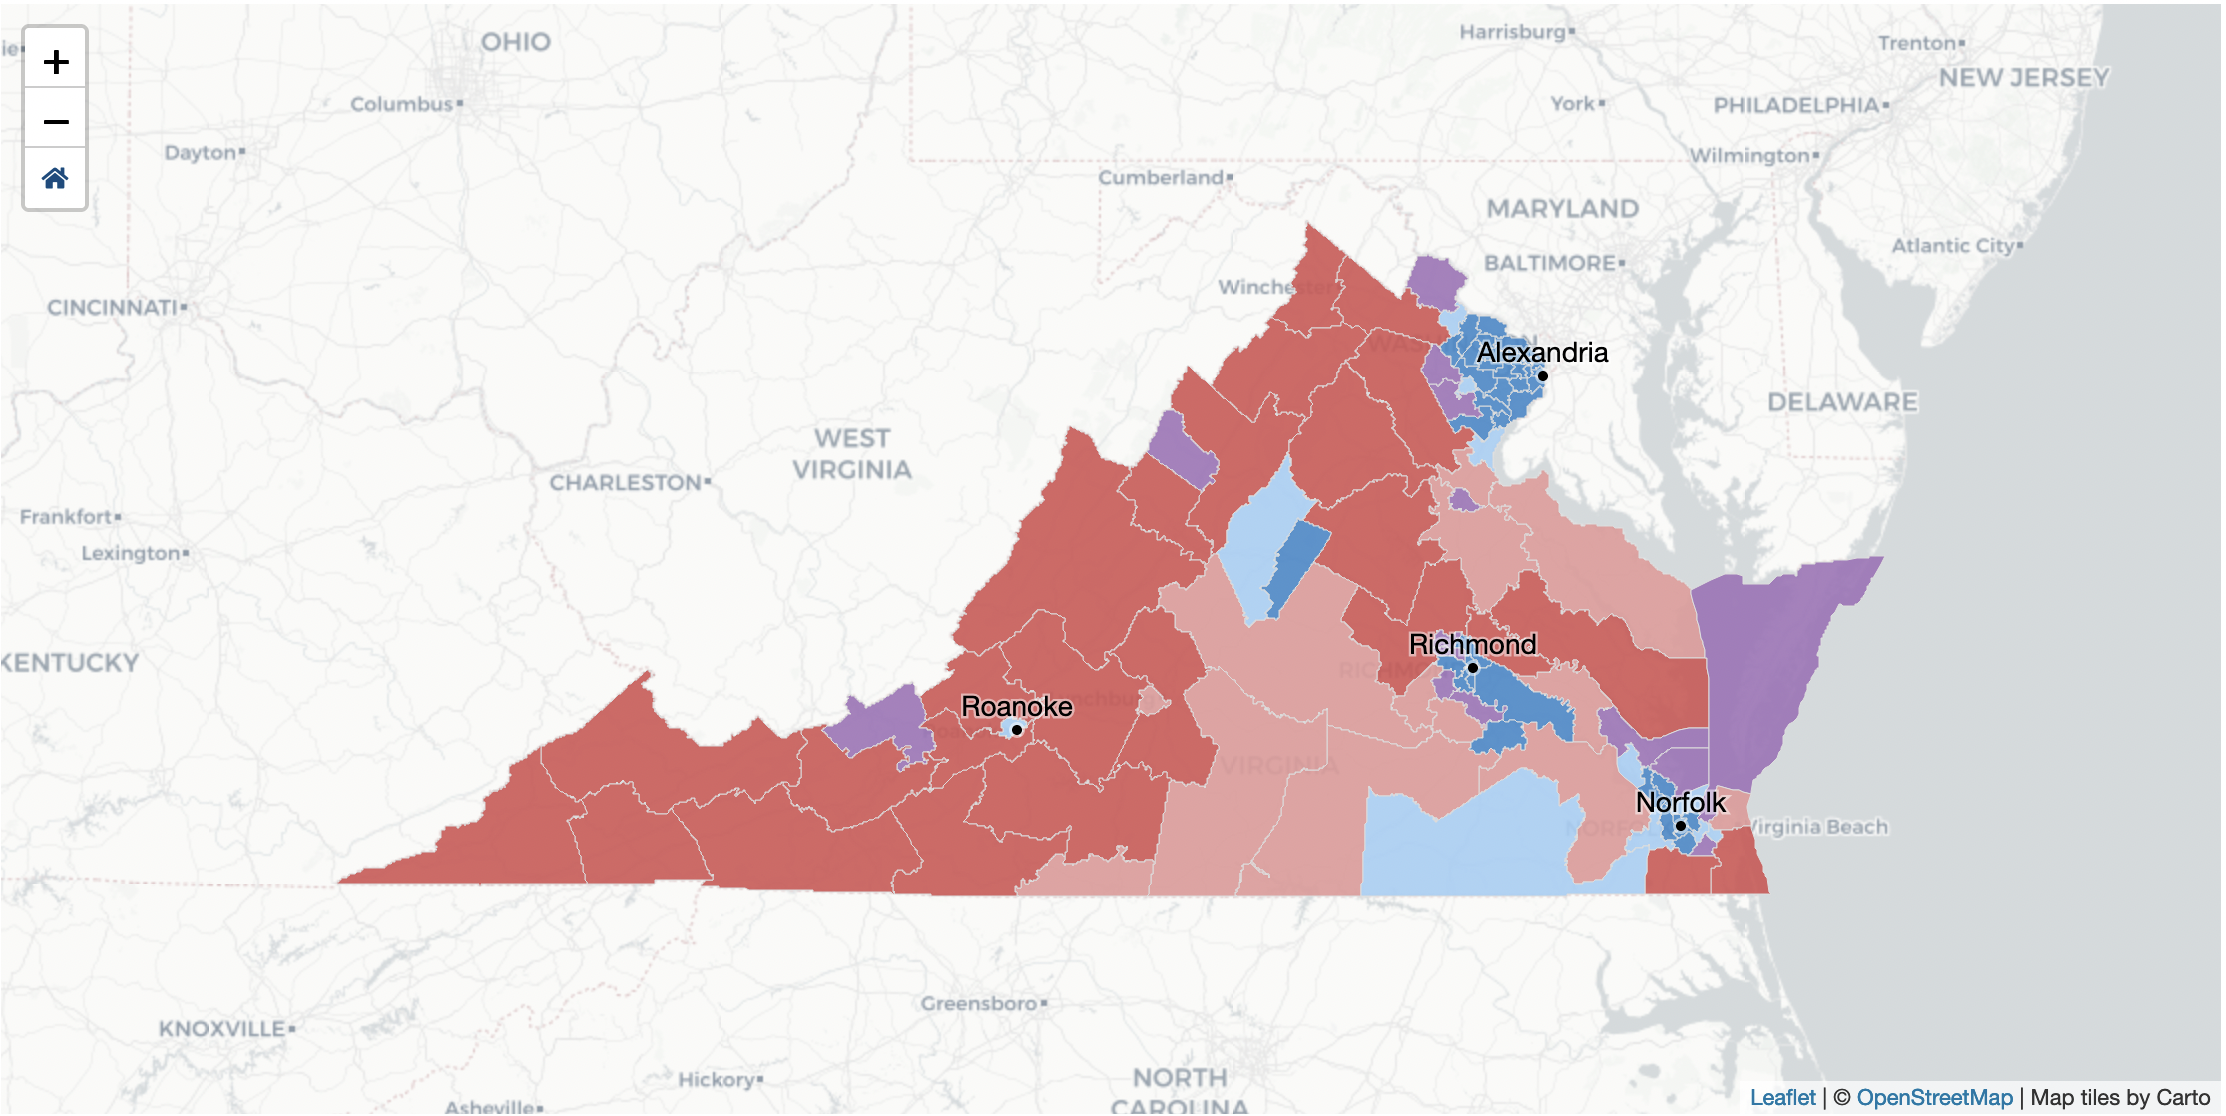
One of the big projects we tackled at VPAP in 2020 is Virginia's redistricting process. With a Redistricting Commission in charge of trying to create new districts, we've been able to visualize and help people make sense of draft plans. I built the front-end code for the maps and charts in this multi-page web application.
Visualizations

In 2020, The Virginia GOP decided to run a multi-round, ranked-choice election where delegates' votes were weighted based on where they lived. Despite having only a week to design and build the pages, we created a live election results page. I built the front-end code in d3 and Svelte, as well as much of the server-side code in Django.
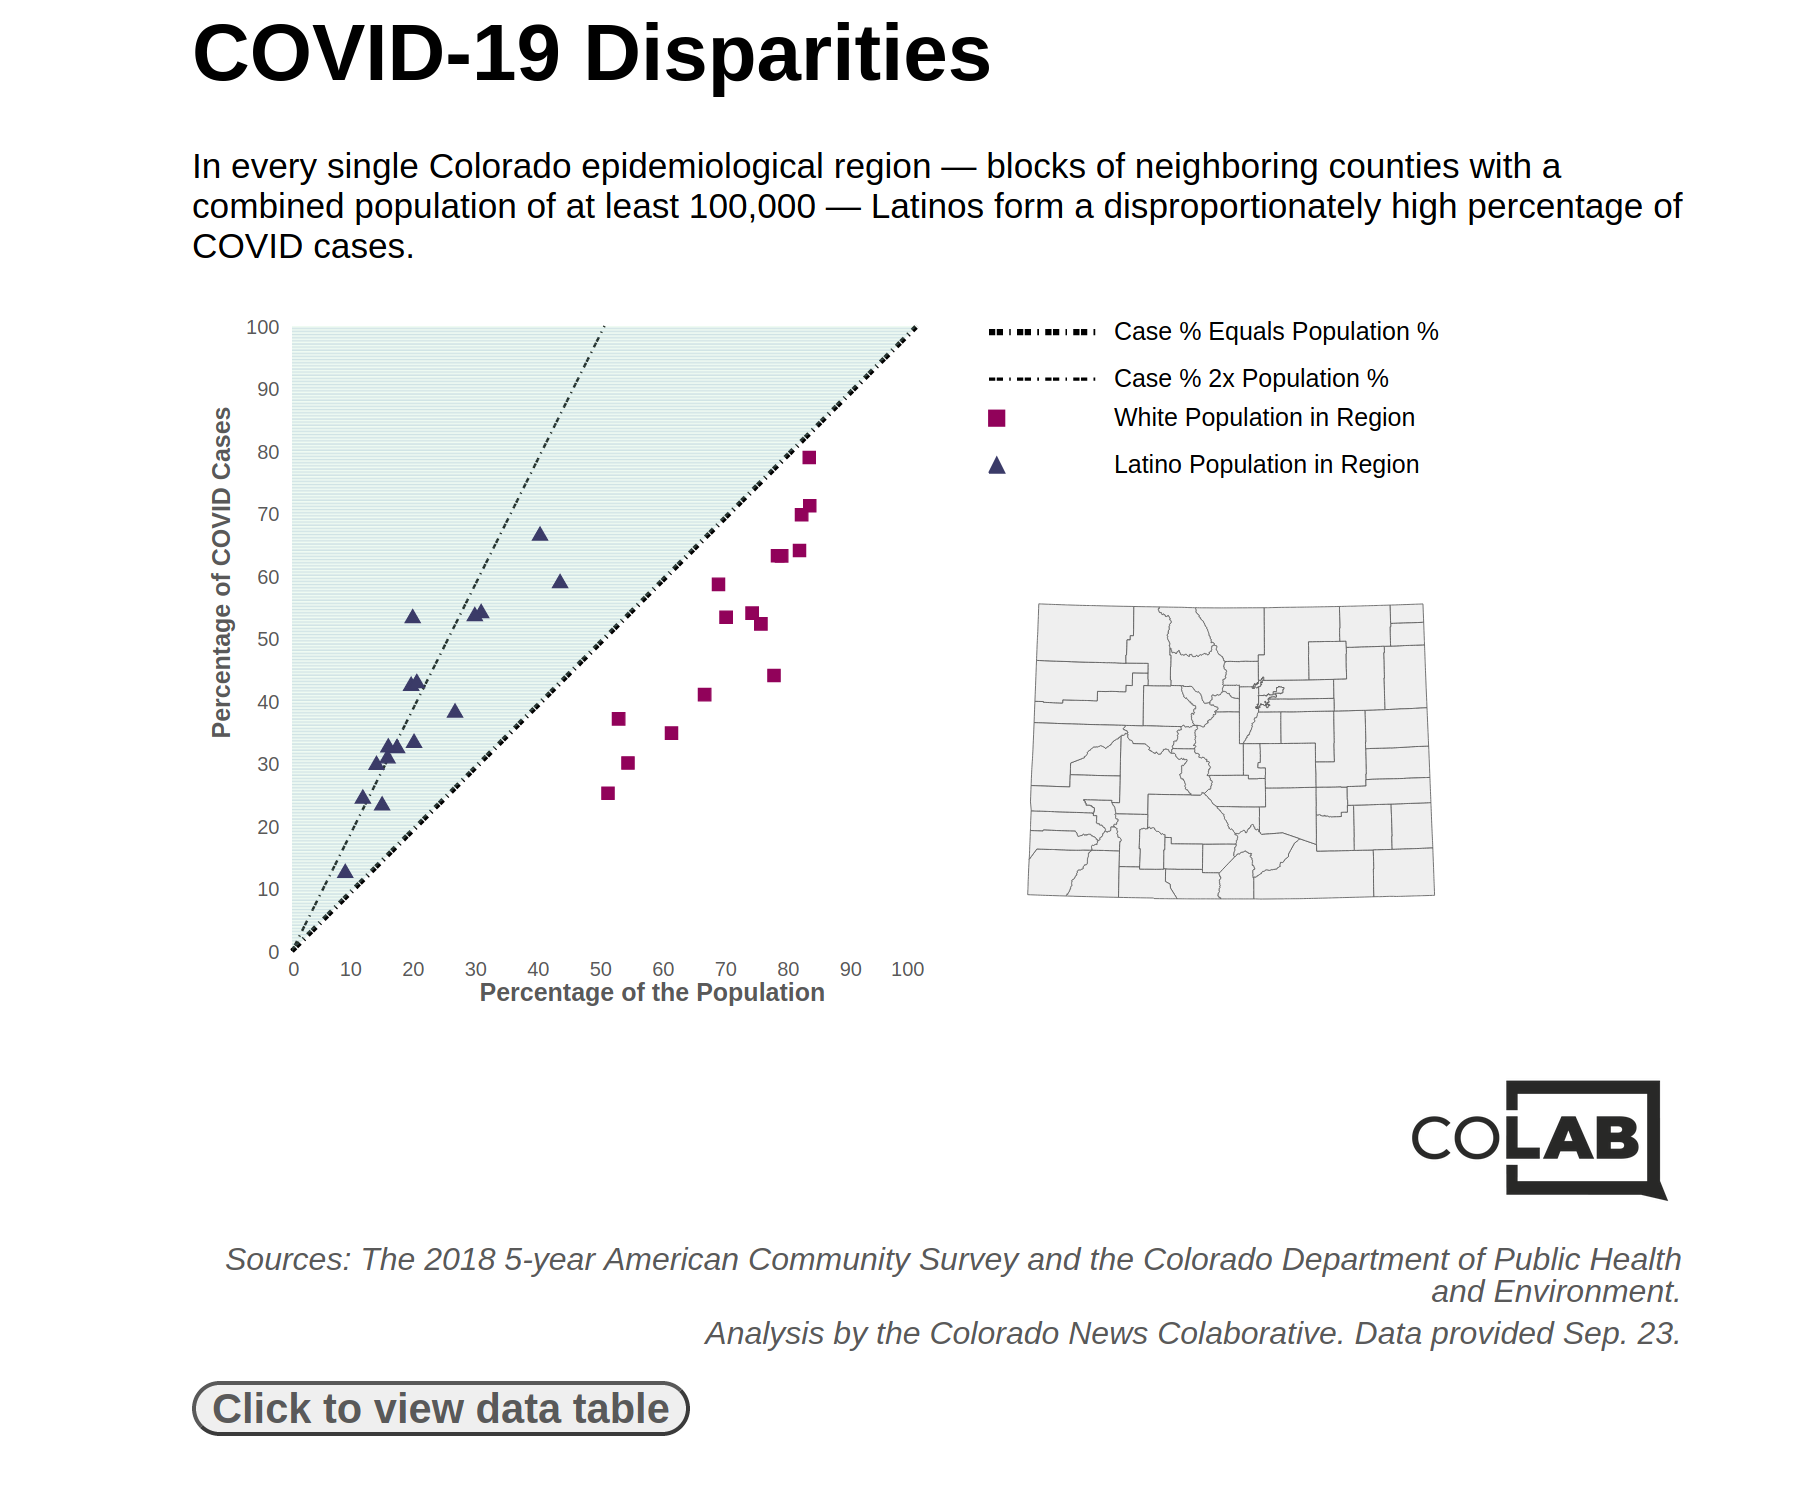
I conducted an analysis and reported most of the interviews for a story showing that Latinos formed a disproportionate rate of COVID-19 cases in every region of Colorado. I also built a graphic displaying the results, using Svelte and a tiny bit of d3.
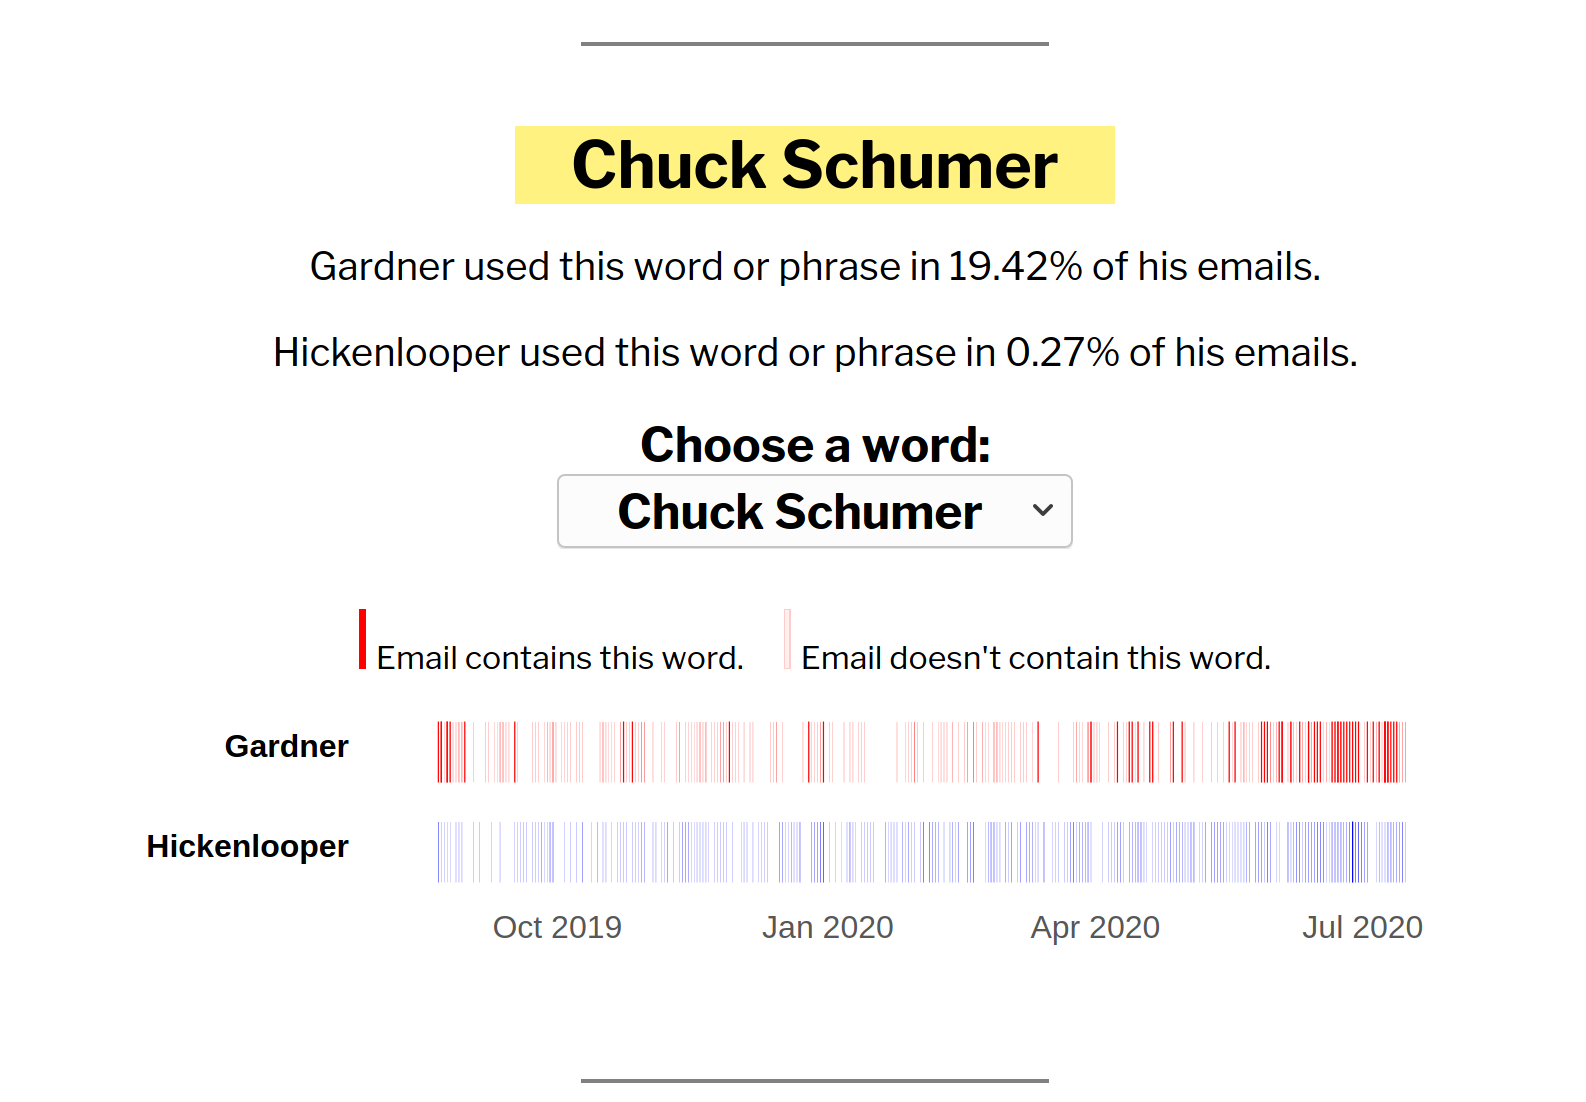
I conducted an analysis and wrote a story about how Senate candidates John Hickenlooper and Cory Gardner used more partisan language in their emails than they did in their campaigns. The pattern is a common feature of campaign emails, which are geared toward a partisan base.
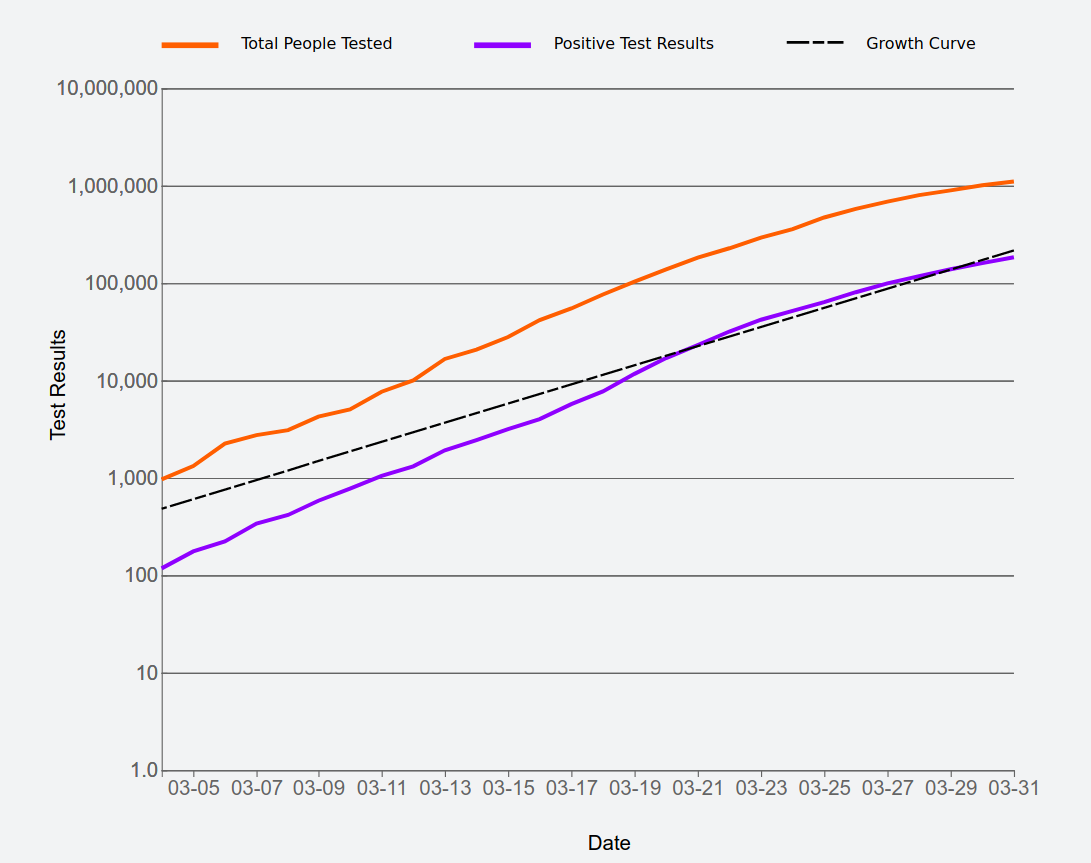
Coronavirus cases have been growing rapidly in the United States, from only around 100 positive tests across the entire country on March 4 to over 5,000 less than two weeks later.
Some of that growth is because testing has become much more available. But the disease itself also poses an enormous threat, holding the potential to overwhelm our health care system.
Using data from the COVID Tracking Project, see how positive and total test results have grown across the country since March 4.