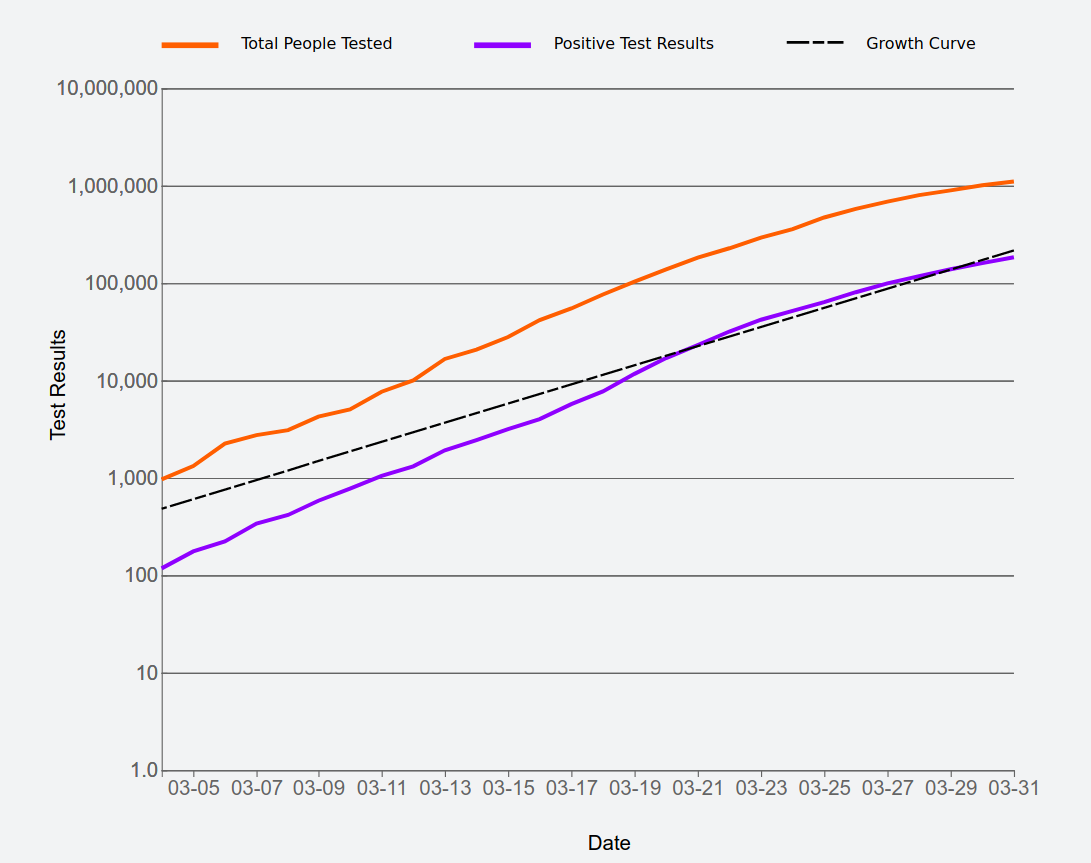
Coronavirus cases have been growing rapidly in the United States, from only around 100 positive tests across the entire country on March 4 to over 5,000 less than two weeks later.
Some of that growth is because testing has become much more available. But the disease itself also poses an enormous threat, holding the potential to overwhelm our health care system.
Using data from the COVID Tracking Project, see how positive and total test results have grown across the country since March 4.
Note that this data originated from a variety of state and county public health departments, which publish their information in inconsistent and often undocumented ways. In particular, in some cases, it's unclear whether test results are referring to the number of specimens tested (typically, 2 per person) or to the number of people tested. Additionally, states can be inconsistent in how they publish test results from private labs and in how they publish negative test results. And finally, states have changed their reporting requirements over time. I highly recommend you read the COVID Tracking Project's state guide for more information.
United States
As of , there have been tests, positive tests, and deaths.
Results by :
total test results
positive test results
deaths
State and national test results come from the COVID Tracking Project through the project's API. The map of U.S. states comes from Mike Bostock's U.S. Atlas TopoJSON, a cleaned-up and simplified adaptation of the state map from the 2017 U.S. Census TIGER Shapefiles.
Additionally, I used a JSON snippet from timelyportfolio on bl.ocks to connect state names and FIPS codes to the COVID Tracking Project's API. Finally, this uses a number of open-source JavaScript libraries (specifically d3, topojson, moment, and regression-js).